Audiogram Graph
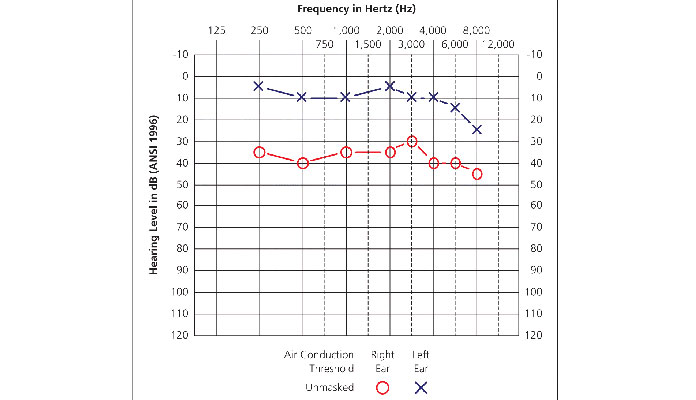
The audiogram is simply a graph with two axes:
– The horizontal axis or X-axis shows the frequency of the sound. It is measured in hertz (Hz) on a scale from 125 Hz up to 8000 Hz. Low numbers display low-frequency sounds, such as thunder or bullfrogs. High numbers represent high-frequency sounds, such as a cricket or a whistler.
– The vertical axis or Y-axis represents the loudness or intensity of the sound. It is measured in decibel (dB) on a scale from -10 dB to 120 dB. [2]